MACD Indicator: What No One Will Tell You About That Could Cost You Money
The MACD Indicator: What No One Will Tell You About That Could Cost You Money
by D.R. Barton, Jr., Contributing Editor
Thursday, October 6, 2005: Issue # 155
“A single advantage is worth a thousand sorceries.” Turkish proverb
General information can be worse than no information at all.
I was shopping for home theater equipment for our newly finished basement. I wanted to know what worked best for the price range I was willing to pay. So I went down to the local newsstand and bought a few “buyer’s guides” for home theater equipment. What a disappointment.
These rags were more than willing to tell me who made the equipment, what the manufacturer’s specs were, and even where to buy. But not one of them told me how well the systems performed relative to one another.
I had paid for a lot of useless information Lots of data, but nothing that helped me to use it intelligently.
I find that lots of traders and investors are equally frustrated with technical analysis. There are lists of technical indicators that you can use. But rarely are we given the real, unvarnished truth about which indicators and techniques work and which don’t.
Today, I’m going to give you the unvarnished truth about one of the most popular technical indicators out there: the MACD Indicator (Moving Average Convergence-Divergence indicator). It’s a good indicator and can be very useful. But one popular technique for using MACD could wind up costing you a lot of money if you’re not careful.
Here’s what I mean…
The Big MACD Indicator: A Technical Analyst’s Super-Value Meal
Over the past two months, we’ve analyzed two markets here in Trader’s U articles that were making tops (Crude Oil and Gold). We drew two different conclusions about their future direction. One of the main technical tools that I used was the Moving Average Convergence-Divergence Indicator (MACD).
Most analysts call it the “Mac-D.”
[cfsp key=”mid-content-callout”]
The MACD was developed by Gerald Appel, and is based on exponential moving averages (EMA). But since it uses the difference in the moving averages, these traditionally lagging indicators become a momentum oscillator.
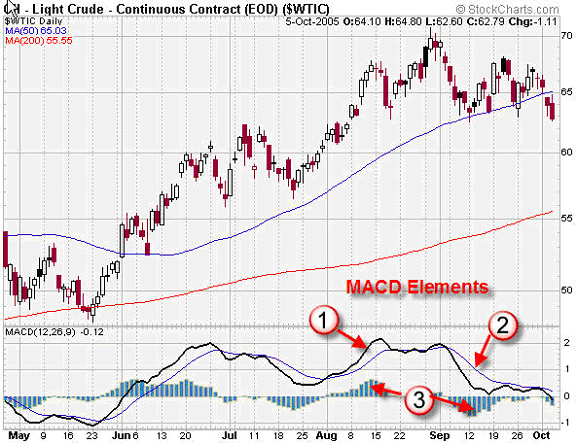
For all of our math-minded friends out there, I give the exact calculations for the MACD below in the “Tips & Tricks” section. But for now, all we need to know is that there are three components to the MACD, as shown in the chart below (the numbers refer to the circled numbers in the chart):

1. The MACD fast line – black thick line
2. The MACD signal line – blue thin line
3. The MACD histogram – the powder-blue bar chart that shows the difference between the MACD fast line and signal line.
How to Apply MACD: Popular vs. Useful
There are the two ways to use the MACD Indicator that are widely discussed in the trading analysis.
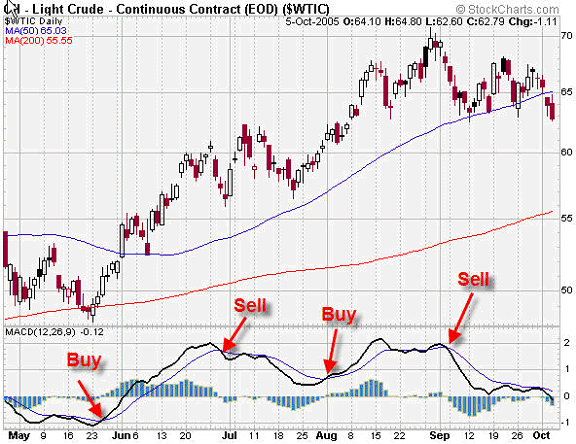
MACD Crossover. The most commonly discussed way to use the MACD is to buy the instrument being charted when the fast line crosses above the signal line (bullish crossover) and sell (or short) it when the fast line crosses below the signal line (bearish crossover). From our previous crude oil chart, these signals look very appealing!

The crossovers in the chart above look great! But – hindsight is always 20/20! There are two things to note about using MACD crossovers:
- They work well in trending markets. Just like any garden-variety moving average crossover. (And the crude oil prices in our chart have certainly trended well in the past year!)
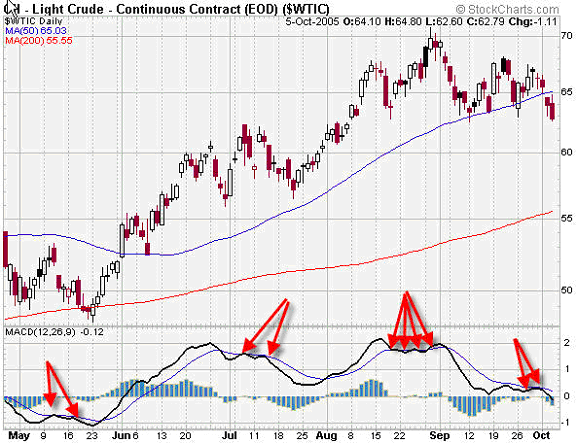
- The “Achilles heel” of this crossover system is that you get a lot of false (i.e. losing) signals in choppy markets. For example, even in the nicely trending oil chart below, look at how many false signals are generated (as designated by the red arrows):

What No One Is Telling You about the MACD
Here’s the amazing thing that no one will come out and say in their articles and books: MACD crossovers don’t work. (The one exception to this “non-disclosure” oversight is my good friend Chuck LeBeau who does talk about his testing of MACD crossovers in his excellent book. For more on Chuck’s book, see the Tips & Tricks section below.)
Mechanically trading MACD crossovers is a recipe for disaster, especially in choppy or sideways markets. MACD crossovers can be useful when combined with other tools, but here’s a telling (if anecdotal) indication: Of all the traders that I’ve been fortunate enough to study and work with, not one uses MACD crossovers!
But there’s good news – as I’ve mentioned above, the MACD Indicator is very useful when used in its convergence-divergence role. Next week we’ll dig into the application of MACD for helping us identify market turning points. Until then
Calculating the MACD Indicator:
- The MACD fast line is calculated by taking the difference between two Exponential Moving Averages (EMAs) – traditionally the 12 and 26 period EMAs
- The MACD signal line is a EMA of the MACD fast line (which traditionally uses 9 period EMA of the MACD fast line)
- THE MACD histogram is a bar chart that shows the difference between the two lines above: Mathematically, it is the MACD signal line subtracted from the MACD fast line.
- You can experiment with the periods used for the MACD. In addition to the traditional (12, 26, 9) that was originally proposed by Appel, you may try shorter periods for shorter time-frame trading.
Great trading,
D.R. Barton, Jr.