

ABCD Pattern Trading: Learn the Basics
Day trading is all about recognizing patterns in stock charts, and no concept is more important for new traders to learn than ABCD pattern trading. This pattern appears frequently in stock charts and is easy to spot once you know what you’re looking for. More importantly, it can help you time your buying and selling more effectively. It can also instill confidence in your trading decisions.
There are no “sure things” in day trading. But ABCD pattern trading is one of the most trusted indicators for decision-making because it’s the product of market fundamentals in action.
What Is the ABCD Pattern?
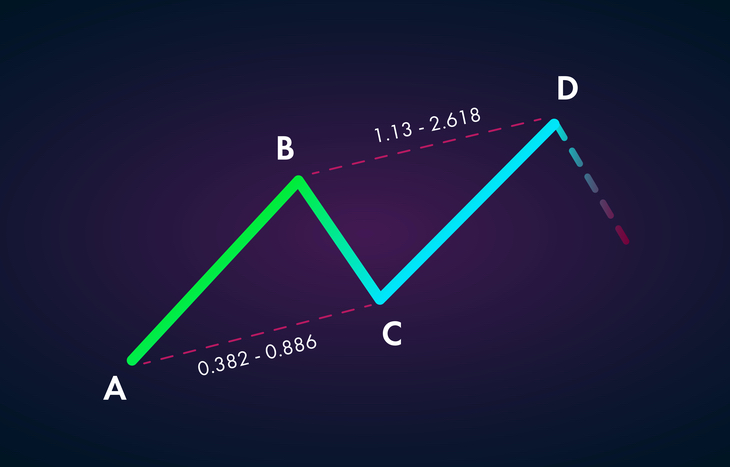
As the name implies, the ABCD pattern is a four-step sequential behavior of a stock that’s evident in its charting. It’s comprised of three consecutive price swings (A, B, C) and a buy/sell action (D). This type of pattern can manifest over any period of time, in any market. Here’s how it works:
A. The stock hits an initial price spike, then falls.
B. The stock establishes a new intraday low.
C. The stock reaches a new support leve.
D. The stock breaks point A.
The up and down action of a stock may seem chaotic to new traders. However, establishing the high, low and support levels gives traders a sense of how the stock will perform going forward. It’s a good indicator of when to enter or exit a position before the stock ticks up or down again.
There are three types of ABCD patterns, which apply to both bullish and bearish trajectories: AB=CD, Classic ABCD and ABCD Extension. There are rules that govern each pattern, but the principle is the same for each: a fluctuation of the price in quantifiable consistency. What changes is the time frame, or how quickly a stock reaches the key levels in an ABCD pattern.
Why Is the ABCD Pattern Important?
ABCD pattern trading is the simplest of all market patterns to recognize, and it’s the basis for other patterns. The reason is that it’s rooted in the Fibonacci sequence – a process that involves dividing one number by another in sequence as part of a pattern.
In the case of ABCD pattern trading, traders are looking for the key Fibonacci ratio of 61.8%. Point C will ideally be 61.8% of AB. If that’s the case, traders can use the sequence to predict when to enter or exit their positions by charting the value of D using the Fibonacci sequence.
Identifying an ABCD pattern is also the first step in identifying other patterns, such as a flag pattern or a rising/falling wedge. A convergence of patterns atop the ABCD pattern is generally a strong signal that the stock is behaving in a predictable way. This gives traders confidence when entering or exiting a position at higher values.
Common Mistakes in ABCD Pattern Trading
The biggest pitfall in ABCD pattern trading is seeing an ABCD pattern where there isn’t one. Active stocks that are subject to large swings over a short time period may show indicators of an ABCD pattern. But despite a trending direction, it can be difficult to establish support levels in these stocks.
It’s also important to observe volume when looking for ABCD patterns. Volume tends to be high as the pattern is forming (hence the action) and consolidated as the trend culminates. If there’s low volume when the pattern is forming, that’s a red flag. The pattern might not be the result of regular trading action. It might be the result of external factors that could make the setup more volatile than desired.
The Final Word
Day traders are always analyzing stock movement and scouring the internet for financial reports and news releases. Save yourself the trouble and sign up for the Trade of the Day e-letter below. This daily newsletter provides stock picks, trends and insights from some of Wall Street’s top experts.
ABCD pattern trading is something every day trader needs to have in their arsenal. It’s equal parts observation, math and logic. And it is far and away the most consistent pattern because it’s rooted in market fundamentals. When time, price and shape all manifest in a stock chart in the form of an ABCD pattern, it’s a good indicator for making a smart trading decision.


