

Butterfly Pattern Trading: Learn the Basics
Markets can be volatile at times. But even amid volatility, there are opportunities for pattern trading – including butterfly pattern trading. This charting pattern is the product of volatility and deals with distinct swings in the market. Like most technical patterns, it’s named for the shape it manifests: two converging triangles – or, if you will, a butterfly.
This technical pattern and its affiliated trading strategy are for advanced traders. It’s one thing to recognize a butterfly pattern; it’s another thing entirely to understand the ratios necessary to act on it. That said, it’s important to understand what you’re looking at when a butterfly pattern shows up on a stock chart.
What Is a Butterfly Pattern?
Butterfly patterns are reversal chart patterns with four distinct points that define them. They’re also defined by Fibonacci ratios, which makes them harmonic patterns. This is part of what makes them so difficult to trade, unless you have an inclination for Fib ratios and harmonics.
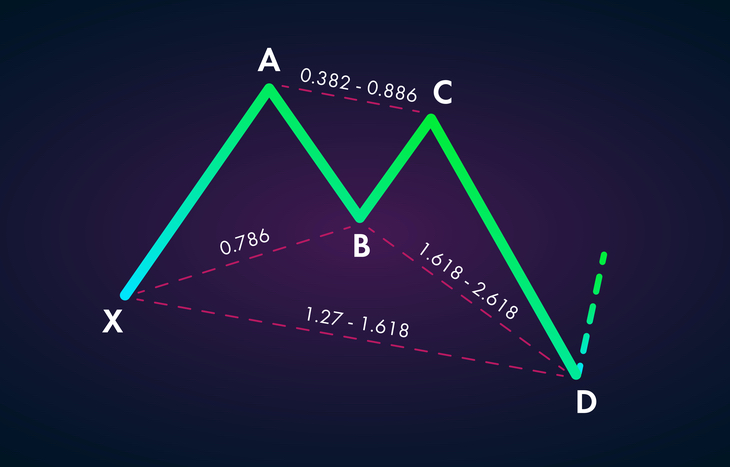
Like all technical patterns, the butterfly pattern has ABCD pattern roots, with the accompaniment of an X starting point. In the case of butterflies, AB=CD, with proportionate relation to X. This is where Fibonacci ratios come in. Butterfly patterns have very specific ranges and requirements:
- AB has an ideal target of 78.6% of XA.
- BC has a range of 38.2-88.6% retracement of AB.
- CD is a 1.618-2.618% extension of AB and between 1.272-1.618% of XA.
In fact, these ratios serve to create the butterfly pattern and the thresholds for trading. Point D in the pattern is the Potential Reversal Zone, where traders can use the Fibonacci ratios to enter a short or long position with confidence. For example, these patterns have stop-loss thresholds built in just beyond the 1.618% extension of the XA leg.
Why Are Butterfly Patterns Important?
Butterfly patterns are important because they signal reversal. And, because these patterns are harmonic, traders can calculate the relativity of the reversal – provided they’re comfortable with Fib ratios. These patterns tend to signal the end of a trend, which is an opportunity for experienced traders.
The other reason butterfly patterns are important is because they’re relatively reliable. Because the Fibonacci ratio builds stop-loss and price targets in, they’re easy to trade. If you have the technical ability to successfully define a butterfly, you can act with reasonable confidence at the Potential Reversal Zone.
Common Mistakes
It’s important to pay close attention to the Fib ratios in a butterfly pattern to ensure you’re not charting a bat or crab pattern. These are similar harmonic patterns, but with different ratios. Mistaking key ratios can affect how you chart the projected pattern and disrupt your levels.
Along these lines, development of the pattern is key. A butterfly trading strategy doesn’t congeal until the pattern is complete. This means you need to identify the key legs to calculate the Fibonacci ratios to see if they fit the pattern.
The Final Word
The most common trading patterns can be difficult to identify for new investors. But you can get ahead of the trends and build toward financial freedom with Liberty Through Wealth. Sign up for the Liberty Through Wealth e-letter below. This daily newsletter is packed with stock tips and analysis for anyone looking to build wealth in their life.
Butterfly pattern trading can be confusing, even for experienced technical traders—as can all harmonics. If you’re comfortable with Fibonacci ratios and have experience charting patterns, the butterfly can prove to be a very reliable pattern to trade. The biggest difficulty is finding swings in the market volatile enough to track a butterfly pattern. Thankfully, obvious swings and volatility tend to breed butterflies. Recognizing and charting them will help you capitalize on this price instability.


