How Safe Is Your Portfolio?
Last week, we received some excellent feedback in response to Monday’s article on calculating a stock’s beta.
So today, I’m going to take this little-known metric one step further by showing you how to manage risk by calculating your portfolio’s overall beta.
You can determine the beta of your portfolio by multiplying the percentage of the portfolio of each individual stock by the stock’s beta and then adding the sum of the stocks’ betas.
For example, imagine that you own four stocks.
You own ADMA Biologics (Nasdaq: ADMA), a small cap biotech with a 2.59 beta, and Cisco Systems (Nasdaq: CSCO), a networking giant with a 1.23 beta.
Let’s say you also own Oxford Income Letter-recommended NextEra Energy Partners (NYSE: NEP), which has a 0.87 beta, and insurance firm Hallmark Financial Services (Nasdaq: HALL), which sports a low 0.56 beta.
(Remember from last time, a stock’s beta compares its volatility with the overall market’s. The market’s volatility is always 1.)
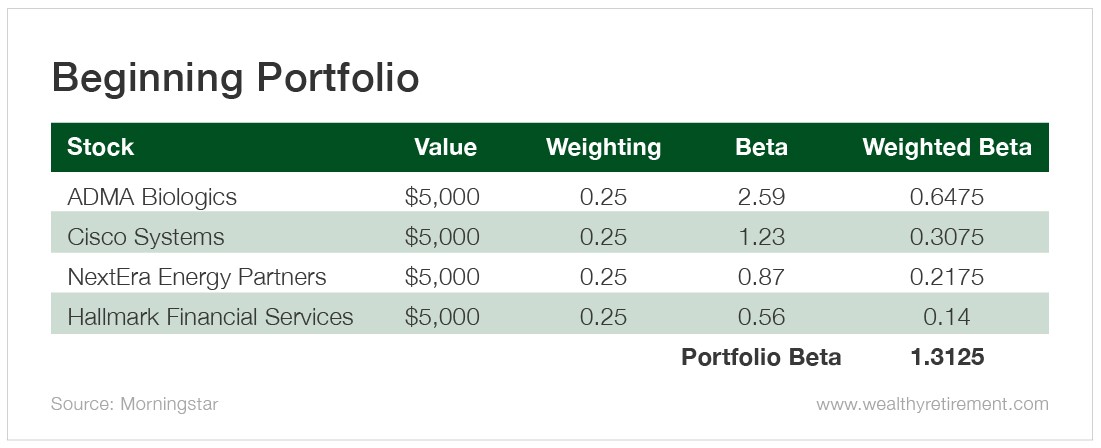
You own $5,000 of each stock, giving each position a 25% weighting in your portfolio…
Portfolio Beta Calculation Example
So your portfolio is about 31% more volatile than the S&P 500.
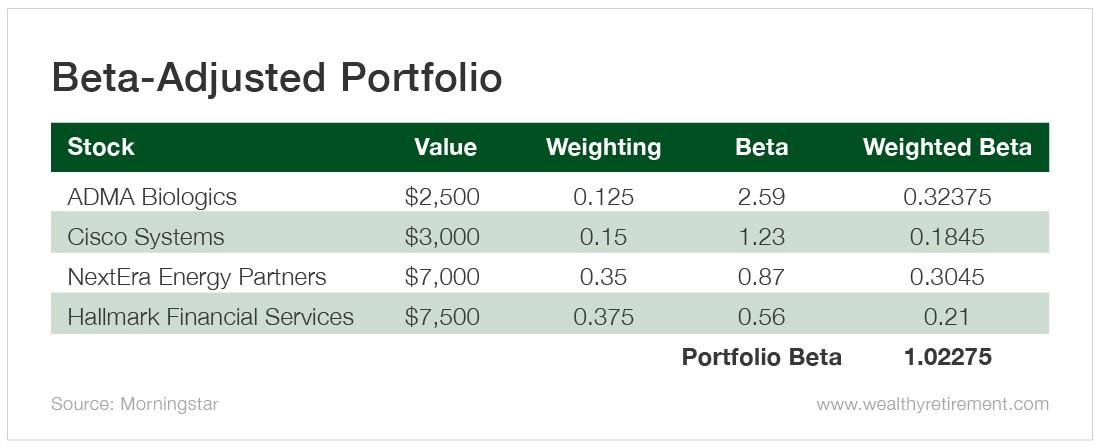
If you wanted to reduce the volatility in your portfolio to bring it more in line with the S&P, you could sell half of your ADMA Biologics and put that money into Hallmark Financial Services.
You could also move $2,000 of your Cisco holdings into NextEra Energy Partners. Let’s look at the portfolio after making those moves.
So you can use beta to reduce or increase your portfolio risk depending on market conditions and your risk tolerance.
A stock’s beta is easy to find. Most large free stock market sites on the internet list beta when you look up an individual stock.
So next time you start getting worried about a big market decline, check your portfolio’s beta to see just how worried you should be and if you need to make any adjustments.
Be sure to sign up for the Wealthy Retirement e-letter below. This FREE e-letter is full of stock market tips, trends and retirement strategies to build towards a life of financial independence.
About Marc Lichtenfeld
Marc Lichtenfeld is the Chief Income Strategist of Investment U’s publisher, The Oxford Club. He has more than three decades of experience in the market and a dedicated following of more than 500,000 investors.
After getting his start on the trading desk at Carlin Equities, he moved over to Avalon Research Group as a senior analyst. Over the years, Marc’s commentary has appeared in The Wall Street Journal, Barron’s and U.S. News & World Report, among other outlets. Prior to joining The Oxford Club, he was a senior columnist at Jim Cramer’s TheStreet. Today, he is a sought-after media guest who has appeared on CNBC, Fox Business and Yahoo Finance.
Marc shares his financial advice via The Oxford Club’s free daily e-letter called Wealthy Retirement and a monthly, income-focused newsletter called The Oxford Income Letter. He also runs four subscription-based trading services: Technical Pattern Profits, Penny Options Trader, Oxford Bond Advantage and Predictive Profits.
His first book, Get Rich with Dividends: A Proven System for Earning Double-Digit Returns, achieved bestseller status shortly after its release in 2012, and the second edition was named the 2018 Book of the Year by the Institute for Financial Literacy. It has been published in four languages. In early 2018, Marc released his second book, You Don’t Have to Drive an Uber in Retirement: How to Maintain Your Lifestyle without Getting a Job or Cutting Corners, which hit No. 1 on Amazon’s bestseller list. It was named the 2019 Book of the Year by the Institute for Financial Literacy.


