


- It may seem like the U.S. has its share of challenges ahead for 2020 – partisan politics, rising healthcare costs and an aging population, to name a few.
- Today, Nicholas Vardy takes a look at where the U.S. economy stands as we head into a new decade.
As a kid growing up in the 1970s and 1980s, I held two truths to be self-evident.
First, the Soviet Union would dominate the U.S. militarily. Second, Japan would dominate the U.S. economically.
Both fears seem almost quaint today.
By 1989, the Japanese stock market reached its historic high – a level it has not seen since.
By 1991, the Soviet Union was wiped off the map. The U.S. won the Cold War. And today, the U.S. still dominates the global economy.
Yes, partisan vitriol characterizes the U.S. political scene. Healthcare costs continue to soar. Regulations continue to stifle small business.
Yet the United States remains by far the world’s wealthiest nation, as measured by gross domestic product (GDP). And the rest of the world doesn’t even come close.
In 2018, U.S. GDP hit $20.5 trillion. That made the U.S. economy as large as the next three largest economies in the world – China, Japan and Germany – combined.
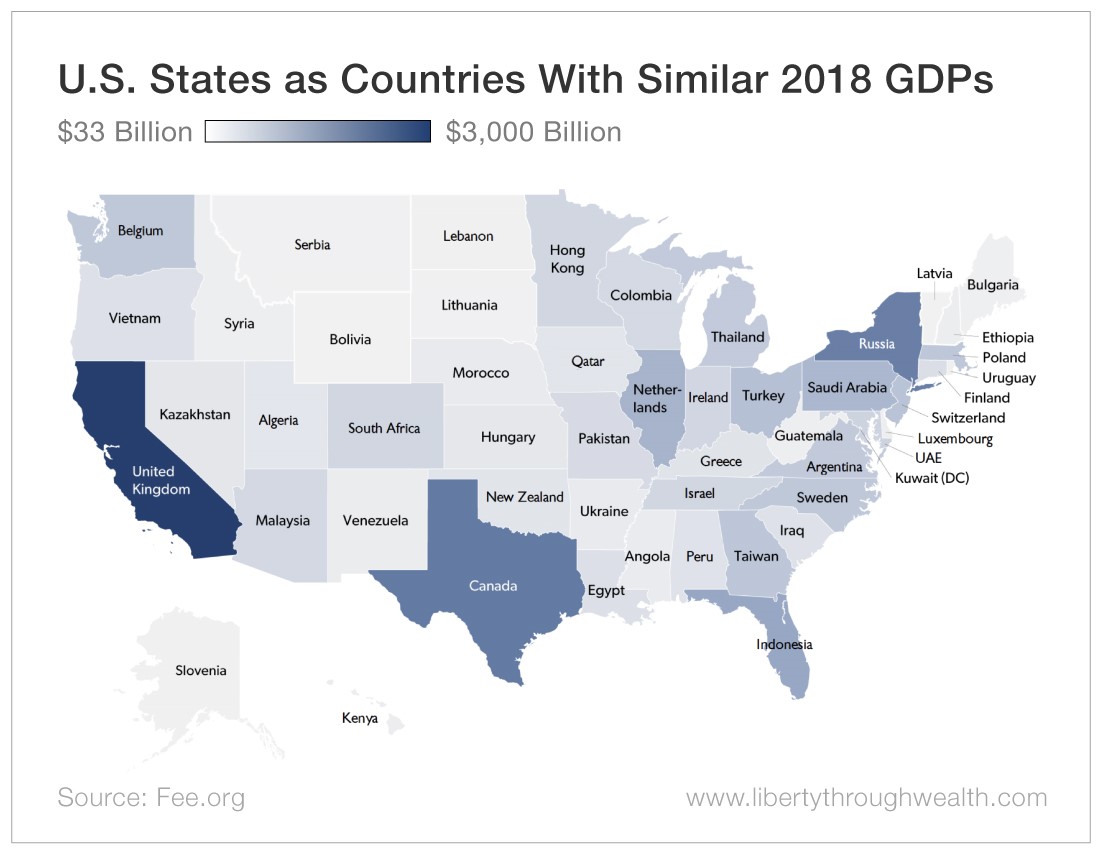
In 2003, Earl Fry – a professor of political science at Brigham Young University – produced a map of the U.S. in which he renamed the states with countries that have similar GDP levels.
The 2018 version of this map puts the size of the United States versus its global economic rivals in perspective.
America’s Big Three Economies
Studying the map leads to some fascinating – and unexpected – comparisons.
The largest state economy in the U.S. is California. The Golden State had a gross state product (GSP) of nearly $3 trillion in 2018. California, as a separate country, would have been the fifth-largest economy in the world in 2018, ahead of the U.K., France and India.
America’s second-largest state economy – Texas – had a GSP of $1.8 trillion in 2018. That made the state roughly equal to Canada. The Lone Star State would have been the world’s 10th-largest economy last year.
New York, America’s third-largest state economy, had a 2018 GSP of $1.67 trillion. As a country, New York would have ranked as the world’s 11th-largest economy last year. That put it ahead of No. 12 South Korea, No. 13 Russia and No. 14 Spain.
The “big three” plus Florida had GSPs of $1 trillion or more. As individual countries, each would have ranked among the world’s 16 largest economies. Together, these four U.S. states boasted a combined GSP of nearly $7.5 trillion in 2018.
Three More Perspectives
Here are three more insights from the map I’d like to share…
First, the map is based on nominal GDP – how much wealth countries generate in real dollar terms.
In contrast, economists often use purchasing power parity (PPP) when comparing the size of economies.
Think of PPP as similar to a cost-of-living adjustment on a country level. For example, in the United States, $100,000 buys you a lot more in Kansas than it does in Manhattan. That’s why China’s economy has already surpassed the U.S. on a PPP basis.
Yet in nominal terms, it’s only about 60% of the size of the United States.
Second, the map ignores population. Yet this has enormous implications for what economic wealth means to its citizens.
Assume China becomes the largest economy in the world in 20 years. Even if it continues growing at its current pace (a huge assumption!), by 2050 the average Chinese citizen will be no wealthier than Eastern Europeans today.
Finally, the map frozen in time hides some critical dynamics in the global economy.
I first wrote about this map in 2007. Back then, Germany and China – at the time No. 3 and No. 4 on the list of the world’s largest economies, respectively – had economies that were both smaller than the economies of Texas and California combined.
Today, the comparison with Germany still stands. But China is more than twice as big as the two largest U.S. states combined.
In 2007, India’s $800 billion economy was on par with Florida’s. Today, India’s $3 trillion economy is close to three times the size of the Sunshine State’s.
The U.S. Economy: A Remarkable History
In 1790, the United States was a tiny nation of 4 million. Europe’s population was 180 million. India’s stood at 190 million. China’s was at 320 million.
Only seven cities had a population of 5,000 or more; just 12 had a population greater than 2,500. The United States had an agricultural economy and practically no factories.
By 1885, the United States was the world’s No. 1 manufacturer. It produced almost 30% of the world’s manufactured goods – more than the British Empire and Germany.
Fast-forward to 2018, and the U.S. generated 24.3% of world GDP with only about 4.3% of the world’s population.
And the U.S. economic map provides a vivid reminder of America’s economic prowess.
About Nicholas Vardy
An accomplished investment advisor and widely recognized expert on quantitative investing, global investing and exchange-traded funds, Nicholas has been a regular commentator on CNN International and Fox Business Network. He has also been cited in The Wall Street Journal, Financial Times, Newsweek, Fox Business News, CBS, MarketWatch, Yahoo Finance and MSN Money Central. Nicholas holds a bachelor’s and a master’s from Stanford University and a J.D. from Harvard Law School. It’s no wonder his groundbreaking content is published regularly in the free daily e-letter Liberty Through Wealth.


