

Head and Shoulders Pattern Guide for Investors
The head and shoulders pattern is a chart formation that many investors use to recognize stock trend reversals. In fact, it’s considered one of the most reliable indicators available to investors today.
So what does this pattern tell you? And how can you best interpret this data to make trading decisions? Let’s take a closer look below…
Head and Shoulders Pattern Definition
This chart formation is used for many different types of investing. From swing trading to day trading, investors analyze charts and other data to predict potential stock movements.
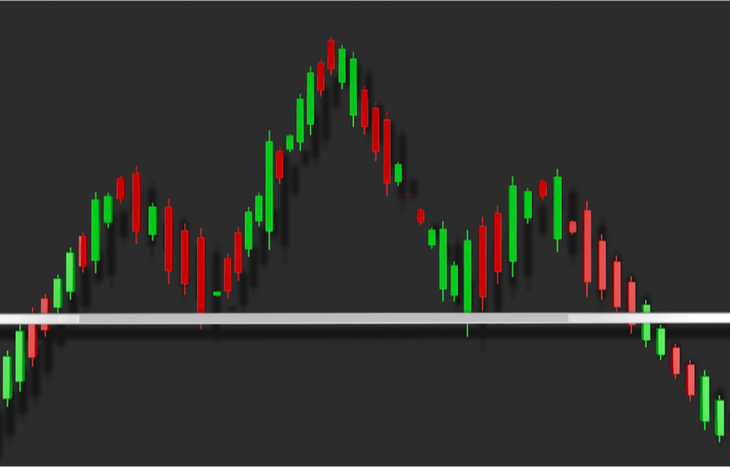
So what is the head and shoulders pattern? It’s a chart formation with three specific peaks and two troughs that appear to give a baseline. The outside peaks (shoulders) are close in height while the middle (head) is highest.
This chart can help you determine when an upward trend is coming to an end. Overall, it’s a bull-to-bear market indicator that is popular in stock market analytics.
A bull market is one in which the economy is healthy and the market is rising. A bear market is quite the opposite. In this instance, the economy is receding and stock prices decline.
Head and Shoulders Pattern Breakdown
The head and shoulders pattern comes in three distinct phases. Each of these components comes together to indicate a trend reversal. In most cases, this pattern indicates an upcoming downward trend. However, it can occasionally show a reversal into an upward trend.
The first component is a stock price hike that comes to a peak before declining back to the base of the prior rise. Next, the price rises above the first peak before declining back to the original base once again. Finally, the third peak rises to the level of the first initial peak before declining back down to the original base.
You can now recognize a baseline to use as an indicator for potential trends. This baseline is often referred to as the “neckline” in the head and shoulders pattern.
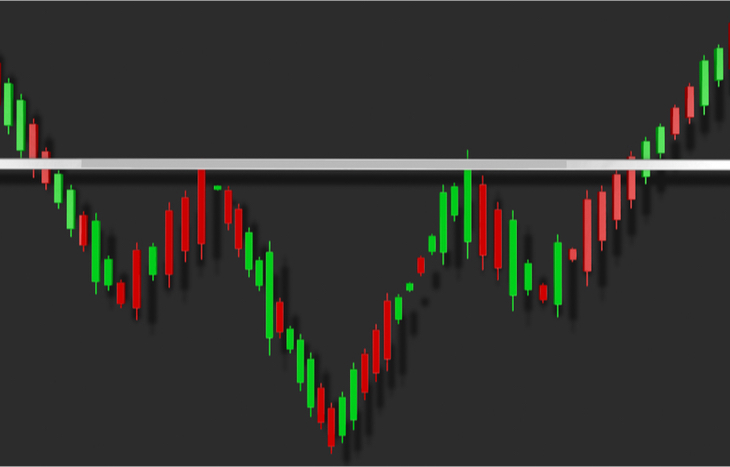
And in comparison, an inverse formation of this pattern would signal an upward trend reversal. In this case, the middle peak will be lowest while the outside peaks will be slightly less shallow.
Stock Market Indicators
Investors analyze more data today than ever before. And this will continue in an effort to better understand market volatility and stock liquidity.
In general, a stock price changes as a direct result of how many people are purchasing or selling the stock. Bulls believe stock prices are going to rise. Bears, on the other hand, believe stock prices will go down. And each will invest their money accordingly.
Are you interested in advancing your stock market knowledge to better recognize trends? If so, sign up for the Trade of the Day e-letter. This FREE newsletter provides expert stock analysis and potential stock trends each and every day.
You can use stock charts, press releases, quarterly financial results and more to determine which stocks are best for your portfolio. And the head and shoulders pattern is one of the most reliable indicators you can find.
About Corey Mann
Corey Mann is the Content Manager of Investment U. He has more than 10 years of experience as a journalist and content creator. Since 2012, Corey’s work has been featured in major publications such as The Virginian-Pilot, The Washington Post, CNN, MSNBC and more. When Corey isn’t focusing on Investment U, he enjoys traveling with his wife, going to Yankees games and spending time with his family.


