

What is a Cup and Handle Pattern?
Technical traders make their living on the recognition of specific stock chart patterns. The more prominent and pronounced the pattern, the easier it is to recognize during formation. Few are as easily recognizable and give as much lead time as a cup and handle pattern.
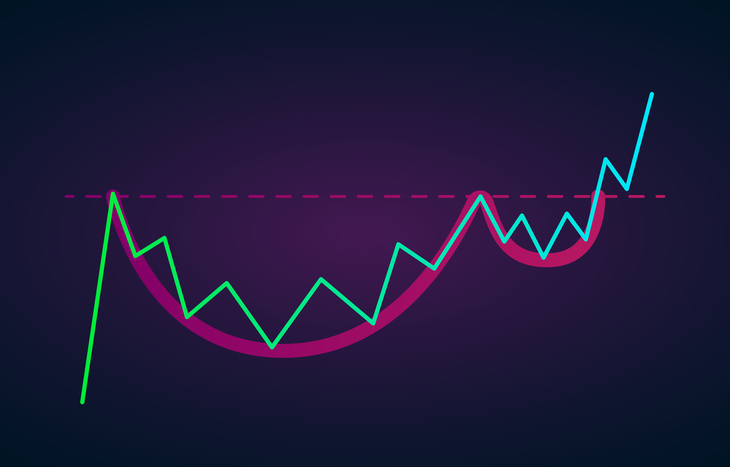
A cup and handle pattern derives its name from the shape it takes on the stock chart. It’s a U-shaped pattern created by a decline in stock price that bottoms-out before trading back up, ending in a period of sideways trading. As the name implies, a cup and handle pattern looks like a cup with a handle. It’s a pattern that often takes tens of weeks to form.
Here’s how to recognize the formation of a cup and handle pattern, what it signifies and how to trade one with confidence.
What’s Going on Behind the Scenes?
The cup and handle pattern is a bullish continuation pattern. That means it’ll ultimately culminate in an upward-trending breakout. It’s important for traders to understand the psychology and market action that contributes to its formation, and there are several phases to consider.
- The pattern begins with an upward trend in stock price that leads to a peak. This suggests bullish sentiment about the company’s performance.
- After peaking, the price of the stock will steadily trade downward after encountering selling pressure. Bears have taken over, and will force the price down as much as a third. During this time, trading volume will shrink.
- After the initial decline, the stock will find support as bears come back in to capitalize on the lower price. However, bears and bulls will battle at this level, causing sideways movement for a period of time (several weeks).
- As bulls retake control, the price begins to trade upward again until it matches its previous high. Look for increased volume at this stage.
- Matching the previous peak, the stock’s volume will taper off. The share price will establish a new level of support that trades sideways for a short term (less than a month).
Identifying support and resistance levels is key in assessing a potential cup and handle pattern, as is monitoring volume. Traders need to look beyond the telltale appearance of a cup and handle on the stock chart and quantify the bullish and bearish sentiments that drive this pattern’s formation.
How to Trade a Cup and Handle Pattern
The cup and handle pattern is one of the easiest to trade. One of the simplest strategies is to wait for the cup to form and use its price data to set entry, exit and stop-loss points for the handle.
For instance, you can place a stop buy order just above the upper trend line of the handle to capitalize as soon as the price breakout begins. A strategy in more uncertain patterns is to place a limit order just below the pattern’s breakout level, which can trigger execution in the event of retracement.
When it comes to taking profits, traders can use the greater pattern to inform exit positions. Often, this is simply a mirror of the distance between the low point of the cup to the breakout level. For instance, if a stock trades for $25 at the bottom of a cup and the handle breakout occurs at $35, traders should set a price target of $45. It’s smart to also establish stop-loss buffers within a tolerance that suits your risk level.
Factors to Consider in Assessing Pattern Strength
There are different variables that can dictate the shape or strength of the cup and handle pattern. Investors should pay attention to the following measures of relative pattern strength:
- Volume. Volume is a key indicator of pattern strength on both sides of the cup formation. Look for gradual pullback in volume during the cup formation and a general ramp up as the stock price rises.
- Length. Typically, a healthy cup and handle pattern has a distinctly rounded bottom. Avoid V-shaped rebounds, as they indicate reactionary buying that could nullify the formation of the handle and subsequent breakout.
- Depth. The ideal cup and handle pattern sees a pullback of about one third from recent highs. The more significant the dip, the stronger the recovery effort needs to be. The same goes for any pullback on price during the handle formation.
No matter what the pattern ultimately looks like on a chart, the cup and handle is a classic continuation pattern. That means the handle will usually break out in significant gains, to mark continued bullish sentiment in the stock.
Drawbacks of the Cup and Handle Pattern
While easy to identify and trade, there are some key drawbacks to cup and handle patterns. The biggest is the time that they take to develop. Most will form between a month and a year, which can make it difficult to spot for traders looking at a narrower scope of stock behaviors. As a result, many traders see a cup and handle pattern too late.
The other chief criticism of this pattern is the prospect for false signals. Shallow cups or retracement that fails to get back to the previous resistance level can see the pattern fall apart when it comes time to form the handle. This is why it’s so important to pay attention to volume when assessing the pattern strength.
Watch for Cup and Handle Patterns
Technical traders looking at stock prices over a longer time period will have no trouble spotting a cup and handle pattern. Before jumping in, take the time to look at the volume behind the trading action and establish the strength of the pattern. Setting entry and exit targets is the easy part, provided the cup and handle pattern culminates in a bullish continuation like you expect it to.


