

Flag Pattern Trading: Learn the Basics
Every day trader is waiting for a big price break. And knowing how to recognize flag pattern trading could put you onto that break before it occurs. Flag patterns are a common occurrence in stock charts. They indicate the potential for a stock’s price to quickly break up or down. They’re an especially important signal in uncertain markets because they signal a sense of stability once a price break has occurred.
Flag patterns are useful on their own or as a confirmation of another, more complex pattern, like a Gartley or butterfly pattern. Recognizing flag pattern trading is simple once you know what you’re looking for. In fact, it’s invaluable once you understand how to act on it.
Recognize Bullish and Bearish Flags
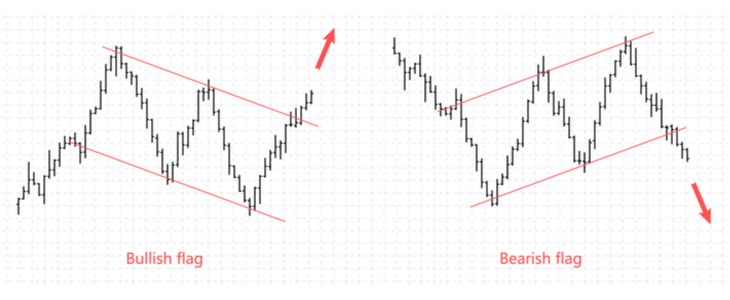
Flag pattern trading manifests when there’s consistent up-and-down action in a stock that’s trending either bullish or bearish. You can roughly connect the peaks and valleys of the stock with parallel lines, with break points exceeding the previous peak or valley. The pattern itself is aptly named because when it manifests, it looks like a flag with the flagpole represented by the price break. Flags can be either bullish or bearish.
- A bullish flag sees the price trending down but poised to break upward.
- A bearish flag sees the price trending up but poised to fall after the break.
In practice, flag pattern trading signals uncertainty in the value of a stock. The break signals that the market has made up its mind about value and there’s likely to be a substantial move either up or down to coincide with the direction of the price break.
Trading against a flag pattern is relatively simple for traders who are able to recognize them as they take shape. By identifying three key points in the flag pattern – the entry, the stop loss and the profit target – traders can expect to enter and exit their positions strategically.
Why Is the Flag Pattern Important?
Flag pattern trading is an important trend to recognize because it brings contextual stability to uncertainty in a stock’s price. The constant ping-ponging up and down signals that a stock is having difficulty finding support levels. This can make traders uncertain about when to enter or exit a position. Once the break occurs, it’s a signal that the trend will continue and traders can feel confident in the continued rise or fall of the share price.
There are also several contributing factors to a flag pattern that help bring certainty and clarity to a stock’s behavior. A volume pattern accompanies a flag pattern and provides context to the price fluctuations.
Common Mistakes in Flag Pattern Trading
Traders who are eager to jump on a flag pattern can enter or exit their position too early, before a price truly breaks. As a flag pattern continues, it can give off false signals – peaks and valleys that near previous levels and even exceed them briefly. Jumping the gun on a price break could mean trading a stock mid-pattern, which can result in missing the price break and the profits that come with it.
The other mistake many traders make when flag pattern trading is being too aggressive with their profit target. Often, the safest way to set this target is to take the average price difference between the flag’s parallel lines and add it to the entry point. For example, if the entry point is $30 and the price difference is $6 ($26 to $32), the profit target would be $36. Being too aggressive often means missing the peak of the price break.
The Final Word on Flag Pattern Trading
As you can see, pattern trading requires a dedication to do research on a daily basis. But with the Profit Trends e-letter, the research is dome for you. The experts at Profit Trends provide daily stock insights and analysis for FREE. You can sign up below for immediate access to this one-of-a-kind newsletter.
Flag pattern trading is a simple strategy that can yield great results if deployed properly. It’s even more valuable when day traders can recognize the formation of a wedge, triangle or pennant pattern emerging from the flag. Recognizing a breakout after a period of consolidation is a great way to make profit-taking or position-opening decisions that favor your portfolio.


