

Swing Trading Strategies That Work
There are various swing trading strategies that investors use in the stock market today. However, what is swing trading? And can this trading style help you bring in consistent returns?
Understanding Swing Trading Strategies
It’s important to define swing trading before diving into the wide range of strategies. So what is swing trading?
Swing trading happens when investors hold on to their position for one or more days to profit on price swings. The goal is to capture short-term gains in no longer than a few weeks. And holding time is the name of the game. It’s essentially the middle ground between day trading and long-term investing.
But how do swing traders determine how long they should hold on to a stock? This is where different swing trading strategies come into play.
For example, many swing traders will devise plans around specific patterns. A few popular patterns are…
- Moving average crossovers
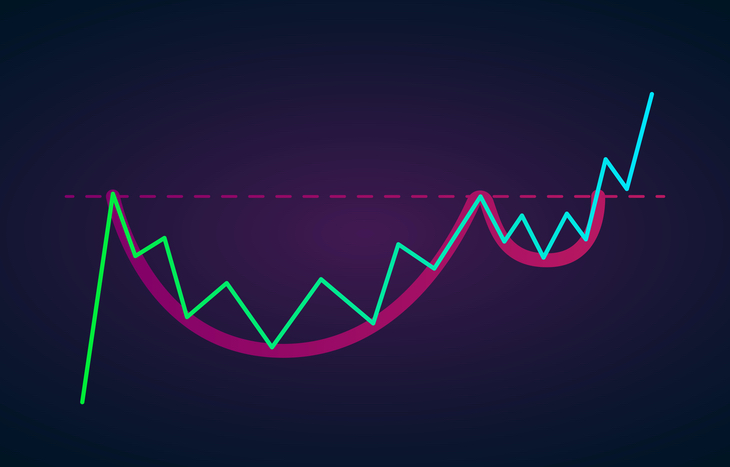
- Cup-and-handle patterns
- Head and shoulders patterns
- Flags and triangles
- Key reversal candlesticks.
Each of these indicators requires data analysis. Moreover, the intention is to use these indicators to predict positive share price movements over a short period of time. As a result, swing traders can make upward of 3% of their total account balance each month, according to The Balance.
Popular Swing Trading Indicators
The most widely used swing trading strategies include moving average crossovers, cup-and-handle patterns, and head and shoulders patterns.
Moving averages are typically the first indicator that swing traders will use. And they can be used in a number of ways, such as indicating potential turning points in share price.
A cup-and-handle pattern, on the other hand, is an indicator you can recognize on stock price charts. And as you may expect, the pattern resembles a cup with a handle on the chart.
The cup is in the shape of a “U” while the handle is shifting downward slightly. This is a bullish strategy that can indicate a downward trend in a stock due to selling pressure.
And lastly, the head and shoulders pattern is a stock price chart indicator with three distinctive peaks. Each of these peaks create a baseline. And traders use this baseline to predict bull-to-bear trend reversals in stocks.

These are the most popular swing trading strategies used by investors today. However, there are many other indicators that swing traders will analyze before investing in a specific stock.
Each of these indicators requires an advanced knowledge of the stock market and investing. Therefore, it’s important to do your research before becoming a swing trader.
Does Swing Trading Work?
Swing trading can bring in steady returns if you compile your data properly and do your research. But there is always risk when investing in the stock market.
Unlike day trading, you are holding on to your stock picks overnight at least. This alone opens you up to more risk due to market volatility.
But you can get ahead of the trends by signing up for Trade of the Day’s FREE e-letter below. This daily e-letter provides expert analysis and stock picks that may enhance your portfolio. You can learn more about the best swing trading strategies that investors use to predict stock price movements.
Read Next: An Introduction to Swing Trading Options: Calls and Puts
About Corey Mann
Corey Mann is the Content Manager of Investment U. He has more than 10 years of experience as a journalist and content creator. Since 2012, Corey’s work has been featured in major publications such as The Virginian-Pilot, The Washington Post, CNN, MSNBC and more. When Corey isn’t focusing on Investment U, he enjoys traveling with his wife, going to Yankees games and spending time with his family.


