

Head and Shoulders Pattern Trading
Head and shoulders pattern trading can be a great way to predict and capitalize on the end of a trend and an impending price reversal. A trend reversal formation, head and shoulders patterns are easy to spot thanks to their signature peaks (or valleys). Don’t confuse them with triple tops or bottoms, though! The head and shoulders pattern is more specific and, thus, easier to spot. It’s a relatively simple pattern to trade if you know what you’re looking for.
Parts of Head and Shoulders Pattern Trading
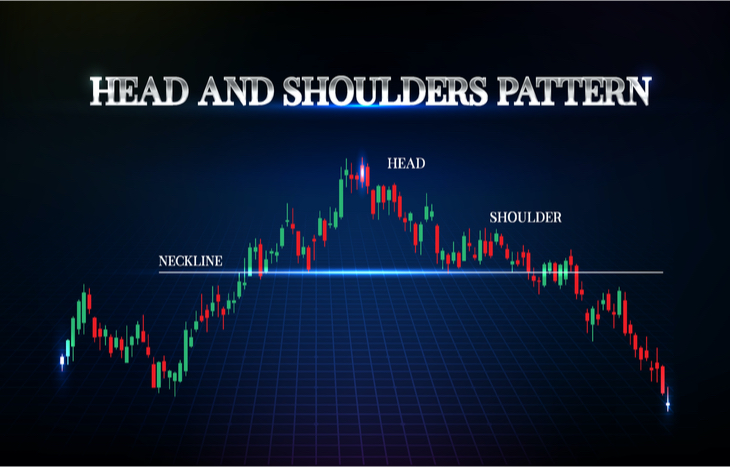
Like most patterns, the head and shoulders pattern represents what it looks like: two shoulders that frame a head. Here’s what it looks like on a chart:
- Price spike (shoulder)
- Higher price spike (head)
- Lower price spike (shoulder)
- Neckline (line between supports)
The psychology behind the head and shoulders pattern is simple enough to understand. The first spike occurs as investors take profits from a security that’s been on the uptrend. This causes the price to fall, which eventually finds new support as investors begin to see it as underpriced. The cycle repeats itself, and the price gains momentum to a new high, starting the sell-off all over again.
As the price nears the neckline after a sell-off from the high, investors often see it as an opportunity to buy again. The final spike is a combination of those who held through the high and those taking profits from entry at the latest support level. The ensuing sell-off is a more dramatic one, causing the price of the security to plunge. This is why head and shoulders patterns are reversal patterns.
Through the formation of the pattern, it’s important to pay attention to the neckline. Not only does it represent the support level that governs the price breakout, but also it can signal the aggressiveness of that breakout. Necklines tend to slope up or down slightly; ascending necklines (uptrends) are more reliable and often more aggressive.
Inverse Head and Shoulders Patterns
While most head and shoulders patterns are bearish, there are inverse representations of this pattern that signal the reversal of a bearish downtrend to a bullish breakout. An inverse can be more difficult to spot and can hide among other bullish patterns. Look for the same signs as you would for a bearish head and shoulders pattern and draw a neckline to establish resistance.
In perfect execution, an inverse head and shoulders pattern will look exactly the same, just flipped upside down. Think of it as going from a “W” shape to an “M” shape with two price spikes and three support levels.
How to Trade Head and Shoulders Patterns
Many traders will unknowingly trade the beginning of a head and shoulders pattern as something else. But, by the time the second shoulder forms, it’s a clear sign of a gathering reversal. With this in mind, it’s important to monitor the downtrend of the second shoulder and use the neckline to set target prices and stop-losses.
Smart traders will put in an entry order below the neckline with a short price target that’s roughly equivalent to the distance between the high point of the head and the neckline. More conversative traders may choose to set target price levels using both the first shoulder and the high point. For inverse (bullish) patterns, it’s the same concept: open a long position just above the neckline, with a target price that mirrors the low.
Common Head and Shoulders Trading Mistakes
There are a few easy mistakes many traders make when tracking head and shoulders patterns. The first is confusing it with a double- or triple-top or -bottom. Easily identifiable, successive spikes don’t always signal head and shoulders. It’s very important that the middle price spike breaks the resistance line between the two shoulders. And, as is the case with physiology, neither shoulder can be above the head.
The other issue traders find themselves facing is faux head and shoulders formations. It’s best to stick to weekly swing trades when trading head and shoulders. Intraday trading on head and shoulders can result in false positives for a variety of reasons. Most often, news of the day can skew a price movement, creating a false pattern where there isn’t one with panic buying or selling.
Finally, it’s easy to get overzealous when setting price targets. A large fall (or run-up) on a price after the breakout can often exceed the inverse spike price target you’ve set. Unfortunately, the rebound might push you out of the money, depending on how aggressive your target price was. It’s better to take profits at a safe level than ride out a volatile price reversal.
The Final Word on Head and Shoulders Pattern Trading
Head and shoulders pattern trading is a great strategy for many traders because it’s one of the more accurate patterns. While the breakout may differ depending on the trading volume at the culmination of the pattern, head and shoulders patterns almost always follow through with a reversal. And, with the neckline to support proper stop-loss and price setting, new traders can feel relatively confident in trading one. If you are looking to enhance your investment knowledge even further, sign up for the Investment U e-letter below.
The best thing a trader can do while head and shoulders pattern trading is wait for the pattern to break the neckline and not try to preempt it. It becomes much easier to set targets once the pattern has shown itself and committed to the breakout, whether bearish or bullish, depending on the formation.


