
The world is getting a grand lesson in economics this week.
Pay attention to it and you’ll see it offers clues on what the stock market may do next.
We’ve talked a good bit about volume in the last few weeks. It’s our specialty not by accident, but because it’s the top driver of all things economic.
The disaster in the oil patch this week proves it.
It’s no secret the price of oil has crashed. And it doesn’t take a mathemagician to understand why.
Demand has plunged.
Folks aren’t driving to work. Jets aren’t dotting the sky. And factories have boarded up their doors.
In all, demand for oil has plunged by about 30%. Meanwhile, the folks pulling the stuff from the ground have pledged to cut supply by just 10%.
The difference between the two numbers must be absorbed somewhere. Oil wells can’t be simply turned on and off like a light. That means the excess volume of oil must go into storage.
But storage is filling fast.
That’s why traders were willing to pay somebody to take their contracts off their hands. They had nowhere to put all the oil they had bought.
[mw-adbox]
A Volume Issue
None of this is new. Pick up a newspaper this week and you’ll get the details.
But what the rags aren’t telling you is that Monday’s negative print was an anomaly… an anomaly tied to volume.
You see, the papers report what we call the front-month contract. That’s the contract that’s set to expire next. In this case, it was the May contract.
It expired Tuesday night.
In other words, Monday’s “historic” negative figure was the result of low trading volume on a contract that was about to expire. That means liquidity was ultra-low.
With the contract set to expire… nobody wanted in. Volume crashed, and so did prices.
It’s why investors who pay attention only to price are in for big trouble.
Volume is the real indicator. Price is merely the result.
An Easier Way to Make Money
Take the stock market as an example. Understanding the role of volume (which we consider critical Know-How) is what turns a novice investor… into a rich investor.
This chart tells the tale. It shows us the volume of the S&P 500 over the last six months. To the trained eye, it reveals all we need to know.
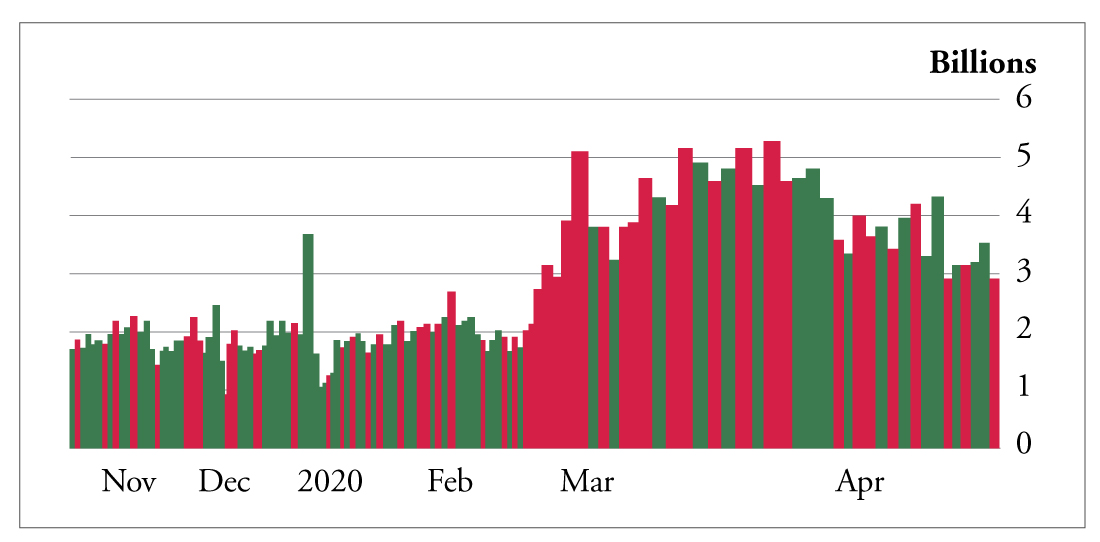 On the left side of the chart is the “normal” action leading up to the mess in late February. Then we get those big red bars, indicating a surge in volume – mainly folks looking to dump their shares.
In mid-March, the volume reaches a plateau. It indicates the peak of a trend – in this case, selling.
As the number of folks pressing the sell button wanes, volume shrinks, starting a new trend higher. That trend will continue until either sellers have a reason to surge into action or buyers move to the sidelines.
Looking at the action in stocks over the last few sessions, the latter is clearly happening.
Volume is falling. That tells us the bargain shopping of the last month or so is stalling and that investors are unsure if stocks warrant higher prices.
With enough bad news, the sellers could once again dominate the equation. And with volume on the decline, it won’t take nearly as much pressure.
Understanding this basic concept puts you in a class above 90% of all investors. Most folks are told the market closed higher or lower the day before and make their moves based on what can best be described as secondary data.
It’s the volume that tells the true tale.
Price is not the indicator to watch. Volume is.
The oil market provided a grand example of the notion this week. But the stock market portrays the beauty of this art every day.
Take advantage of it.
Like what you’re reading? Let us know here.
About Andy Snyder
Andy Snyder is the founder of Manward Press. An American author, investor and serial entrepreneur, Andy cut his teeth at an esteemed financial firm with nearly $100 billion in assets under management. In the years that have followed, he’s become sought after for his outspoken market commentary.
Andy and his ideas have been featured on Fox News, on countless radio stations, and in numerous print and online outlets. He’s been a keynote speaker and panelist at events all over the world – from four-star ballrooms to Capitol hearing rooms – and has rubbed shoulders with lawmakers, lobbyists and Washington insiders. He’s had lunch with John McCain… fished with America’s largest landowner… and even appeared on the Christmas card of one of Hollywood’s top producers.
Today, Andy’s dissident thoughts on life, Liberty and investing can be found in his popular e-letter, Manward Financial Digest, as well as in the pages of Manward Letter. He also is at the helms of the award-winning VIP Trading Research Services Alpha Money Flow and Venture Fortunes. Andy resides on 40 bucolic acres in rural Pennsylvania with his wife, children and a steadily growing flock of sheep.