

What is a Bullish Engulfing Pattern?
Candlestick charting is commonplace for technical traders looking to identify patterns and buy/sell signals. Because candlesticks represent the open, close, high and low prices for a trading period, deciphering patterns is easy. This is especially true for a bullish engulfing pattern.
A bullish engulfing pattern is very easy to spot on a candlestick chart, and it’s a key identifier for impending pattern reversal. If you’re a trader tracking a broader pattern, a bullish engulfing signal can represent a pivotal point in the culmination of that pattern. Often, it’s an opportunity to open a long position and reap the benefits of a bearish trend reversal.
Let’s take a look at bullish engulfing patterns: how they form, what their signals look like and how to capitalize on the reversal one signals.
Identifying a Bullish Engulfing Pattern
If you’re looking at a candlestick chart, you can spot a bullish engulfing pattern relatively easily. They occur in down-trending patterns, and most traders will take note of the sudden bullish activity this pattern heralds.
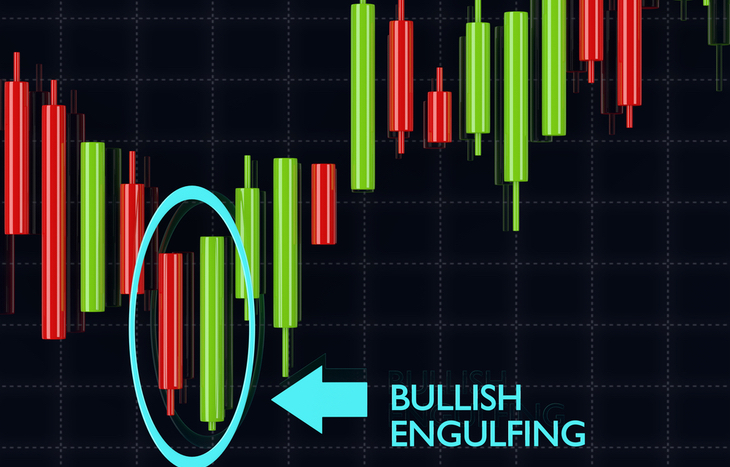
A bullish engulfing pattern occurs when a white (bullish) candlestick completely overlaps a black (bearish) candlestick on the previous trading day. For this to happen, several criteria need to align:
- The white candlestick opens lower than the previous day’s close
- The white candlestick closes higher than the previous day’s open
- White candlestick completely “engulfs” the black candlestick
- The length of the “tails” doesn’t matter; only the candle body matters
The word “pattern” is a bit of a misnomer here. Since it only involves two candles, a bullish engulfing pattern is more akin to a buy/sell signal that occurs at the culmination of a larger pattern.
That said, there are certain criteria that can indicate the relative strength of the impending reversal. For example, if three or four small black candles precede the bullish engulfing candle, it signals a more significant breakout. Moreover, if the bullish engulfing trend presents within a pattern, traders can look at the broader context of that pattern to determine how much momentum is behind the reversal.
The Trading Psychology Behind a Bullish Engulfing Pattern
As with any candlestick pattern, it’s important to understand the psychology behind the visual. What causes a bullish engulfing pattern to form?
This signal represents bullish investors taking control of a stock that bears have previously driven down. Due to the nature of the candlestick, this power struggle happens within a single day: bears open the trading period, while the bulls close it. Hence, a price that opens lower than the previous close (gapping down) and a close that outpaces the previous open.
As a reversal pattern, the strength of a bullish engulfing candle usually means price momentum will follow. The next trading period is likely to open near the high of the bullish close or even above (gapping up), which paves the way for a bullish run as investors open long positions and traders capitalize on the price swing.
Other Important Factors to Consider
While easy to identify, there are a few factors that specifically validate a bullish engulfing trend. As mentioned, if the preceding three or four candles are low-volume black candles, it lends credence to the reversal. Here are a couple of other hints that the reversal is real and sustainable:
- The bigger the gap down between the two candles, the stronger the bullish push to take control of the price. Strong gapping tends to correlate to a stronger reversal.
- The smaller the upper wick (high price) of the bullish candle, the stronger the sentiment of bullish investors. A price that closes close to its high is more likely to open bullish.
- If the engulfing pattern forms amidst choppy price action or when the stock has previously traded sideways, it’s not as strong as an outright reversal.
As with any candlestick pattern, it’s important to observe price in context with factors like volume, to understand why a stock price is behaving like it is. Remember that capitalizing on reversal patterns also means embracing volatility.
Potential Drawbacks for Pattern Traders
As one of the strongest reversal signals, a bullish engulfing pattern is easy to capitalize on. Yet, there are potential problems a trader can run into.
For example, if the engulfing candle is significantly bigger than the bearish candle before it, traders might have trouble setting stop-losses. This, in turn, lowers the ROI on a potential swing trade. Similarly, it’s difficult to establish a price target. If you’re not well-versed in pattern retracing, you risk establishing the wrong exit price, risking profit and inviting risk.
Ultimately, each engulfing pattern requires traders to look at it within the context of trend momentum to better-understand entry/exit points.
Bullish vs. Bearish Engulfing Patterns
Opposite the bullish engulfing pattern is the bearish engulfing pattern. As the name might suggest, it’s the exact inverse and signals an impending downtrend in a stock’s price. It involves a bearish candle that completely engulfs a previously bullish candle. The open is higher than the previous day’s close and the close is lower than the previous day’s open.
Traders trying to capitalize on a bearish engulfing pattern might open up short positions, and investors can use this as a sell signal for their held positions. The signal is strongest when preceded by multiple bullish trading periods of progressively lower volumes.
Ride the Bullish Reversal Trend
A bullish engulfing pattern is a clear sign that things are looking up for a stock. As bulls take control after a bearish period, it’s a good bet that the price will keep climbing. For long investors, it’s a chance to buy. For shorts, now’s the time to cash out. Keep an eye out for a swift yet strong reversal: a baby black candle engulfed by a larger white one.


