Financial Literacy
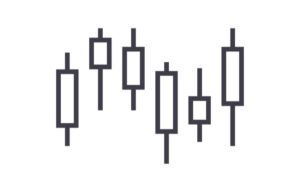
What is a Candlestick Chart?
February 15, 2022
Investors can see pricing action, stock behavior and investor sentiment through an easy-to-read candlestick chart.
What is a Callable Bond?
February 14, 2022
While a callable bond comes with a maturity date, the issuer can actually recall the bond before that date.

Gordon Growth Model: One Valuation Model for Your Investor Tool Belt
February 14, 2022
Investors can discover how much a stock is actually worth by using the Gordon Growth Model. Let’s dig deeper into this model.
What are Closed-End Mutual Funds?
February 13, 2022
If you’re looking for a fund with transparent pricing and potential for higher yields, a closed-end mutual fund might be the best approach.
What is the CAPE Ratio?
February 12, 2022
The CAPE ratio takes a slightly different approach to calculating the earnings-per-share of a market or an individual stock.
What is the Compound Annual Growth Rate (CAGR)?
February 11, 2022
Many investors and analysts use compound annual growth rate (CAGR) as a way to understand how a company has performed over time.

What is Personal Financial Planning?
February 11, 2022
Personal financial planning is a strategy by which you can achieve your financial goals. With that, let’s get started.
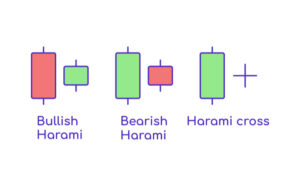
What is a Bullish Harami?
February 10, 2022
Let’s take a look at the bullish harami as a candlestick pattern: how it forms, what it means and what traders can expect after it manifests.
- « Previous Page
- 1
- …
- 11
- 12
- 13
- 14
- 15
- …
- 89
- Next Page »